t Distribution (1 of 2)
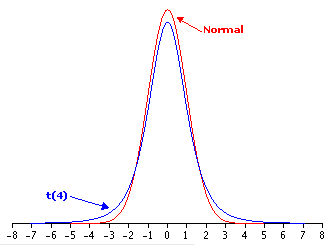
The t distribution is used instead of the normal distribution whenever the standard deviation is estimated. The t distribution has relatively more scores in its tails than does the normal distribution. It is therefore leptokurtic. The shape of the t distribution depends on the degrees of freedom (df) that went into the estimate of the standard deviation. With very few degrees of freedom, the t distribution is very leptokurtic. With 100 or more degrees of freedom, the t distribution is almost indistinguishable from the normal distribution. As the degrees of freedom increases, the t distribution approaches the normal distribution. The larger the kurtosis (the larger the tails), the farther out you have to go from the mean in order to contain a given percentage of the scores. For example, to contain 95% of the t distribution with 4 df, the interval must extend 2.78 estimated standard deviations from the mean in both directions. Compare this to the normal distribution for which the interval need only extend 1.96 standard deviations in both directions. The figure below compares the t distribution with 4 df to the normal distribution.
