t Distribution (2 of 2)
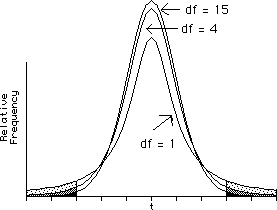
The figure below shows t distributions with 1, 4, and 15 degrees of freedom. Areas greater than +2 and less than -2 are shaded.

This figure shows that the t distribution with 1 df has the least area in the middle of the distribution and the greatest area in the tails. Thus, it is the most leptokurtic.