Factors Affecting Power: Sample Size (1 of 2)
Increasing N, the sample size, decreases the denominator of the equation for z:

and therefore increases power.
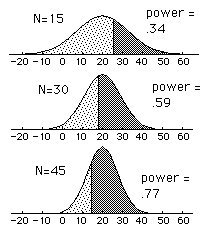
The graphs below show the sampling distribution of M (for the example) when σ = 50 and µdiff = 20. The cutoff points for being significant at the 0.05 level were determined using the formulas:

and

Note how the cutoff point and the variance of the distribution change as N increases. The mean of the distribution does not change.
