Tests of Differences between Means, Dependent Means (3 of 4)
For this example,
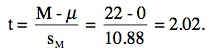
There are 10 - 1 = 9 degrees of freedom (Note that the sample size is the number of difference scores, not the total number of scores.) A t table can be used to find that the probability value is 0.074.
An alternate formula for sM is:
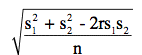
where s1 is the standard deviation of Condition 1, s2 is the standard deviation of Condition 2, n is the number of subjects, and r is the correlation between scores in Conditions 1 and 2. For the example data, s1 = 87.764, s2 = 77.719, n = 10, and r = 0.9206 and therefore sM = 10.88.
An example of a report of this result is shown below.
The mean time to respond to a visual stimulus (M = 319.5) was longer than the mean time to respond to an auditory stimulus (M = 297.5). However, this difference was not statistically significant, t(9) = 2.02, p = 0.074.