Tests of μ, Standard Deviation Known (2 of 4)
- The fourth step is to compute p, the probability
(or probability value) of obtaining a difference
between M and the hypothesized value of µ (7.0) as large or larger
than the difference obtained in the experiment. Applying the
general formula to this problem,

The sample size (N) and the population standard deviation (σ) are needed to calculate σM. Assume that N = 16 and σ= 2.0. Then,

and

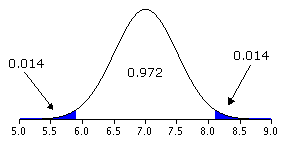
A z table can be used to compute the probability value, p = 0.028. A graph of the sampling distribution of the mean is shown below. The area 8.1 - 7.0 = 1.1 or more units from the mean (in both directions) is shaded. The shaded area is 0.028 of the total area.
