Trend Analysis (2 of 5)
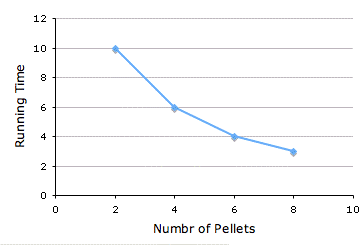
Trend analysis can be used to test different aspects of the shape of the function relating the independent variable (Number of pellets in this example) and the dependent variable (running time). Trend analysis consists of testing one or more components of trend. These components are tested using specific comparisons. The linear component of trend is used to test whether there is an overall increase (or decrease) in the dependent variable as the independent variable increases. The graph below shows that running time decreased as magnitude of reward increased.

A test of the linear component of trend is a test of whether this decrease in running time is significant. If there were a perfectly linear relationship between magnitude of reward and running time, then no components of trend other than the linear would be present. The figure shows, however, that the relationship is not perfectly linear: The slope of the function decreases as magnitude of reward increases. Running time decreases four seconds as the number of pellets increases from two to four, two seconds as the number of pellets increases from four to six, and only one second as the number of pellets increases form six to eight.