Trend Analysis (1 of 5)
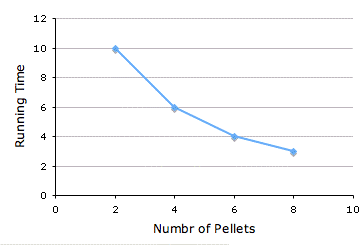
If an experiment contains a quantitative independent variable, then the shape of the function relating the levels of this quantitative independent variable to the dependent variable is often of interest. For instance, consider a hypothetical experiment on the effect of the magnitude of reward on the time it takes rats to run down an alley. Running time as a function of the number of food pellets provided as the reward is shown in the graph below. The graph shows that running time decreased as reward size increased.
