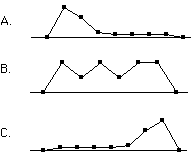
1. Which of the the frequency polygons has a large positive skew? Which has a large negative skew?

Chapter 2
1. Which of the the frequency polygons has a large positive skew? Which has
a large negative skew?

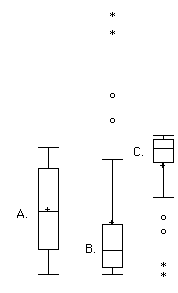
2. Which of the box plots on the has a large positive skew? Which has a large
negative skew?

3. Make up a dataset of 20 numbers with a positive skew. Use a statistical program
to compute the skew and to create a box plot. Is the mean larger than the median
as it should be for distributions with a positive skew. What is the value for
skew? Plot a frequency polygon with these data.
4. Repeat Problem 3 only this time make the dataset have a negative skew.
5. Make up two data sets that have:
(a) the same mean but differ in standard deviations.
(b) the same mean but have different medians.
(c) the same median but different means.
(d) the same semi-interquartile range but differ in standard deviations
6. Assume the variable X has a mean of 10 and a standard deviation of 2. What
would be the mean and standard deviation of a new variable (Y) that was created
by multiplying each element of X by 5 and then adding 4.
7. The dataset below has data on memory for chess positions for players of
three levels of expertise. The numbers represent the number of pieces correctly
from three chess postions. Create side-by-side box plots for these three groups.
What can you say about the differences between these groups from the box plots.
Consider spread as well as central tendency.
|
|
|
|
|
22.1 |
32.5 |
40.1 |
8. For the numbers 1, 3, 4, 5, and 12, find the value (v) for which Σ(X-v)²
is minimized. Find the value (v) for which Σ |x-v|
is minimized.
9. Experiment with the sampling distribution simulation and do the exercises associated with it.
10. What is more likely to have a skewed distribution: time to solve an anagram problem or scores on a vocabulary test?