Sampling Distribution, Difference between Independent Means (2 of 5)
Sample n1 scores from the population of people taking the drug and compute the mean. This mean will be designated as M1. Then, sample n2 scores from the population of people not taking the drug and compute the mean. This mean will be designated as M2. Finally compute the difference between M1 and M2. This difference will be called Md where the "d" stands for "difference." This is the statistic whose sampling distribution is of interest.
The sampling distribution could be approximated by repeating the above sampling procedure over and over while plotting each value of Md. The resulting frequency distribution would be an approximation to the sampling distribution. The mean and the variance of the sampling distribution of Md are:
and
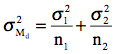 .
.If
 .
.For the present example,