Scatterplots
Next section: Introduction to Pearson's correlation
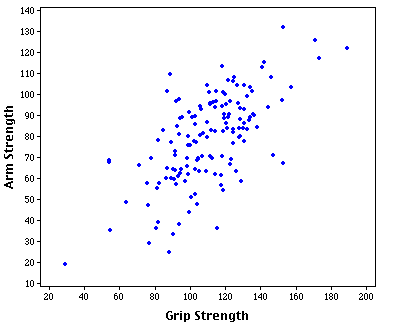
A scatterplot shows the scores on one variable plotted against scores on a second variable. Below is a plot showing the relationship between grip strength and arm strength for 147 people working at physically-demanding jobs. The data are from a case study in the Rice Virtual Lab in Statistics. The plot shows a very strong but certainly not a perfect relationship between these two variables.

Scatterplots should almost always be constructed when the relationship between two variables is of interest. Statistical summaries are no substitute for a full plot of the data.
Next section: Introduction to Pearson's correlation