Standard Deviation and Variance (2 of 2)
Next section: Summary
although less sensitive to extreme scores than the range, the standard deviation is more sensitive than the semi-interquartile range. Thus, the standard deviation should be supplemented by the semi-interquartile range when the possibility of extreme scores is present.
If variable Y is a linear transformation of X such that:
Y = bX + A,
then the variance of Y is:
where
The standard deviation of Y is bσx where σx is the standard deviation of X.
Standard Deviation as a Measure of Risk
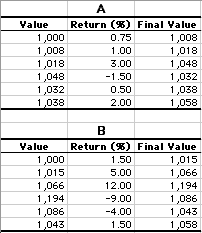
The standard deviation is often used by investors to measure the risk of a stock or a stock portfolio. The basic idea is that the standard deviation is a measure of volatility: the more a stock's returns vary from the stock's average return, the more volatile the stock. Consider the following two stock portfolios and their respective returns (in per cent) over the last six months. Both portfolios end up increasing in value from $1,000 to $1,058. However, they clearly differ in volatility. Portfolio A's monthly returns range from -1.5% to 3% whereas Portfolio B's range from -9% to 12%. The standard deviation of the returns is a better measure of volatility than the range because it takes all the values into account. The standard deviation of the six returns for Portfolio A is 1.52; for Portfolio B it is 7.24.
How to compute the standard deviation in SPSS.
Further Reading:
Risk Management by Michel Crouhy et al.
The Intelligent Asset Allocator: How to Build Your Portfolio to Maximize Returns and Minimize Risk by William J. Bernstein
Personal Finance for Dummies by Eric Tyson
Next section: Summary