Box Plots (2 of 2)
Next Chapter: Describing Bivariate Data
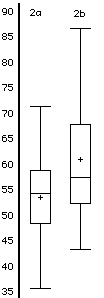 Every
score between the inner and outer fences is indicated by an "o" whereas a
score beyond the outer fences is indicated by a "*".
Every
score between the inner and outer fences is indicated by an "o" whereas a
score beyond the outer fences is indicated by a "*".It is often useful to compare data from two or more groups by viewing box plots from the groups side by side. Plotted are data from Example 2a and Example 2b . The data from 2b are higher, more spread out, and have a positive skew. That the skew is positive can be determined by the fact that the mean is higher than the median and the upper whisker is longer than the lower whisker.
Some computer programs present their own variations on box plots. For example, SPSS does not include the mean. JMP distinguishes between "outlier" box plots which are the same as those described here and quantile box plots that show the 10th, 25th, 50th, 75th, and 90th percentiles.
Next Chapter: Describing Bivariate Data