Interaction (1 of 8)
Two independent variables interact if the effect of one of the variables differs depending on the level of the other variable. The means from the hypothetical experiment described in the section on factorial designs are reproduced below.
| Dose | Simple Task |
Complex Task |
|---|---|---|
0 mg |
32 |
80 |
100 mg |
25 |
91 |
200 mg |
21 |
96 |
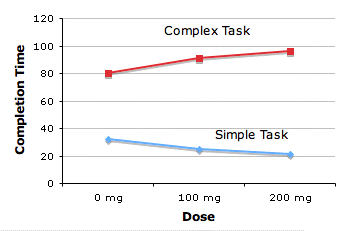
Notice that the effect of drug dosage differs depending on whether the task is simple or complex. For the simple task, the higher the dosage, the shorter the time to complete the task. For the complex task, the higher the dosage, the longer the time to complete the task. Thus, there is an interaction between dosage and task complexity. It is usually much easier to interpret an interaction from a graph than from a table. A graph of the means for the interaction between task complexity and drug dosage is shown below.

The dependent variable (response time) is shown on the Y axis. The levels of drug dosage are shown on the X axis. The two levels of task complexity are graphed separately.