Computing the Correlation in EXCEL
Follow this link for free tutorials on Excel.
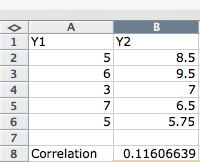
Pearson's correlation is a measure of the relationship between two variables. In EXCEL, you compute it by first selecting the cell in which you want the correlation to appear.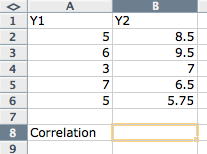
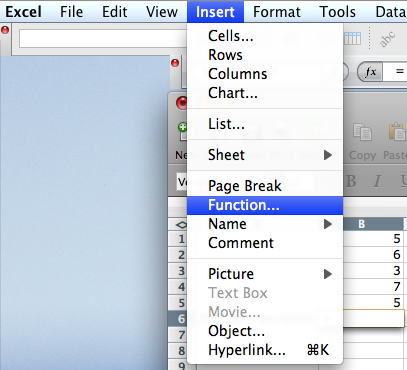
Next you choose Insert/Function from the menu bar.
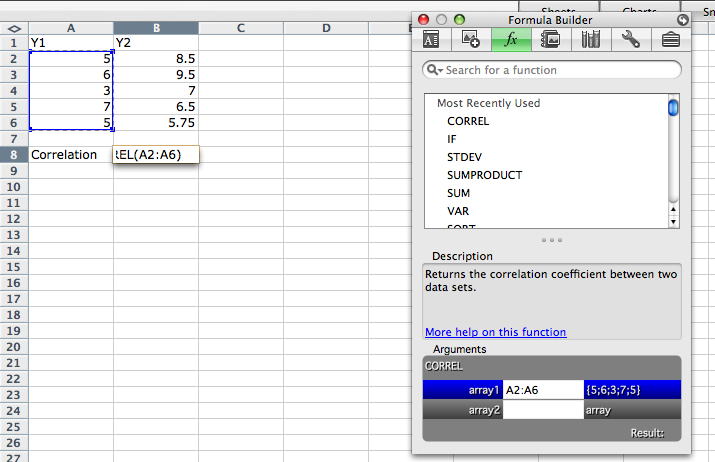
Double click on CORREL from the list. It is in the category "Statistical." The functions are arranged by category with the categories listed in alphabetical order.
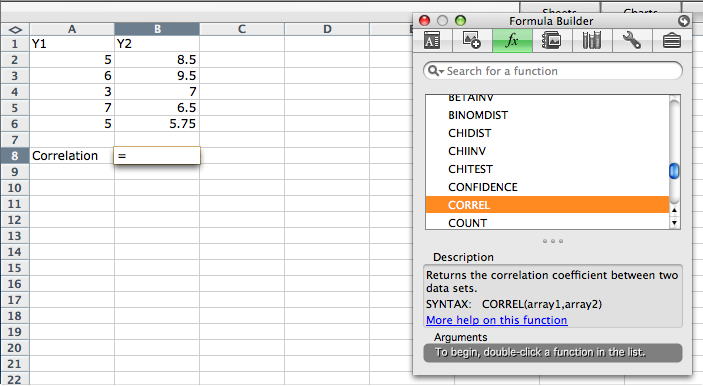
Select the first range of values on the worksheet or enter the range in the field "array 1" in the formula builder.
Click in the field for "array2" and specify the range.
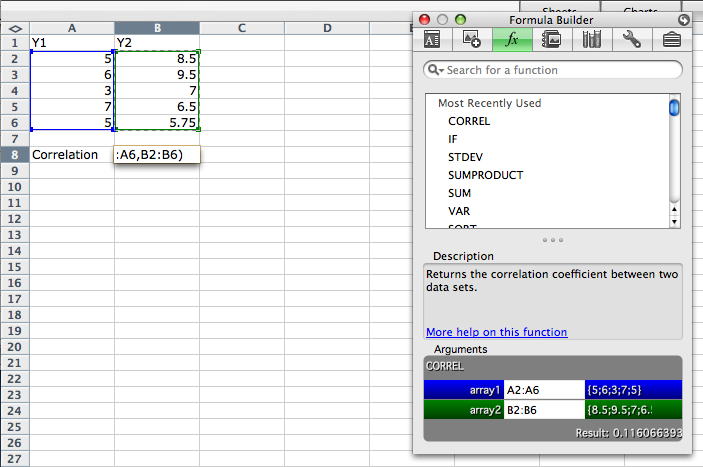
Hit "Enter" or "Return" to confirm the selection and the correlation will be computed.